Data Visualisation
Information Design
Cartography
Editorial
Publication Design
The Global Earthquake Atlas is a publication developed as part of a Data Visualization course, aiming to explore the dynamics of earthquakes worldwide. Initiated after the devastating earthquake in Turkey and Syria on February 6, 2023, the project highlights the responsibility of visualizing scientific data and equips students with tools to tackle complexity. Through maps and visual narratives, the atlas provides insights into earthquake activity since 1900 across all continents.
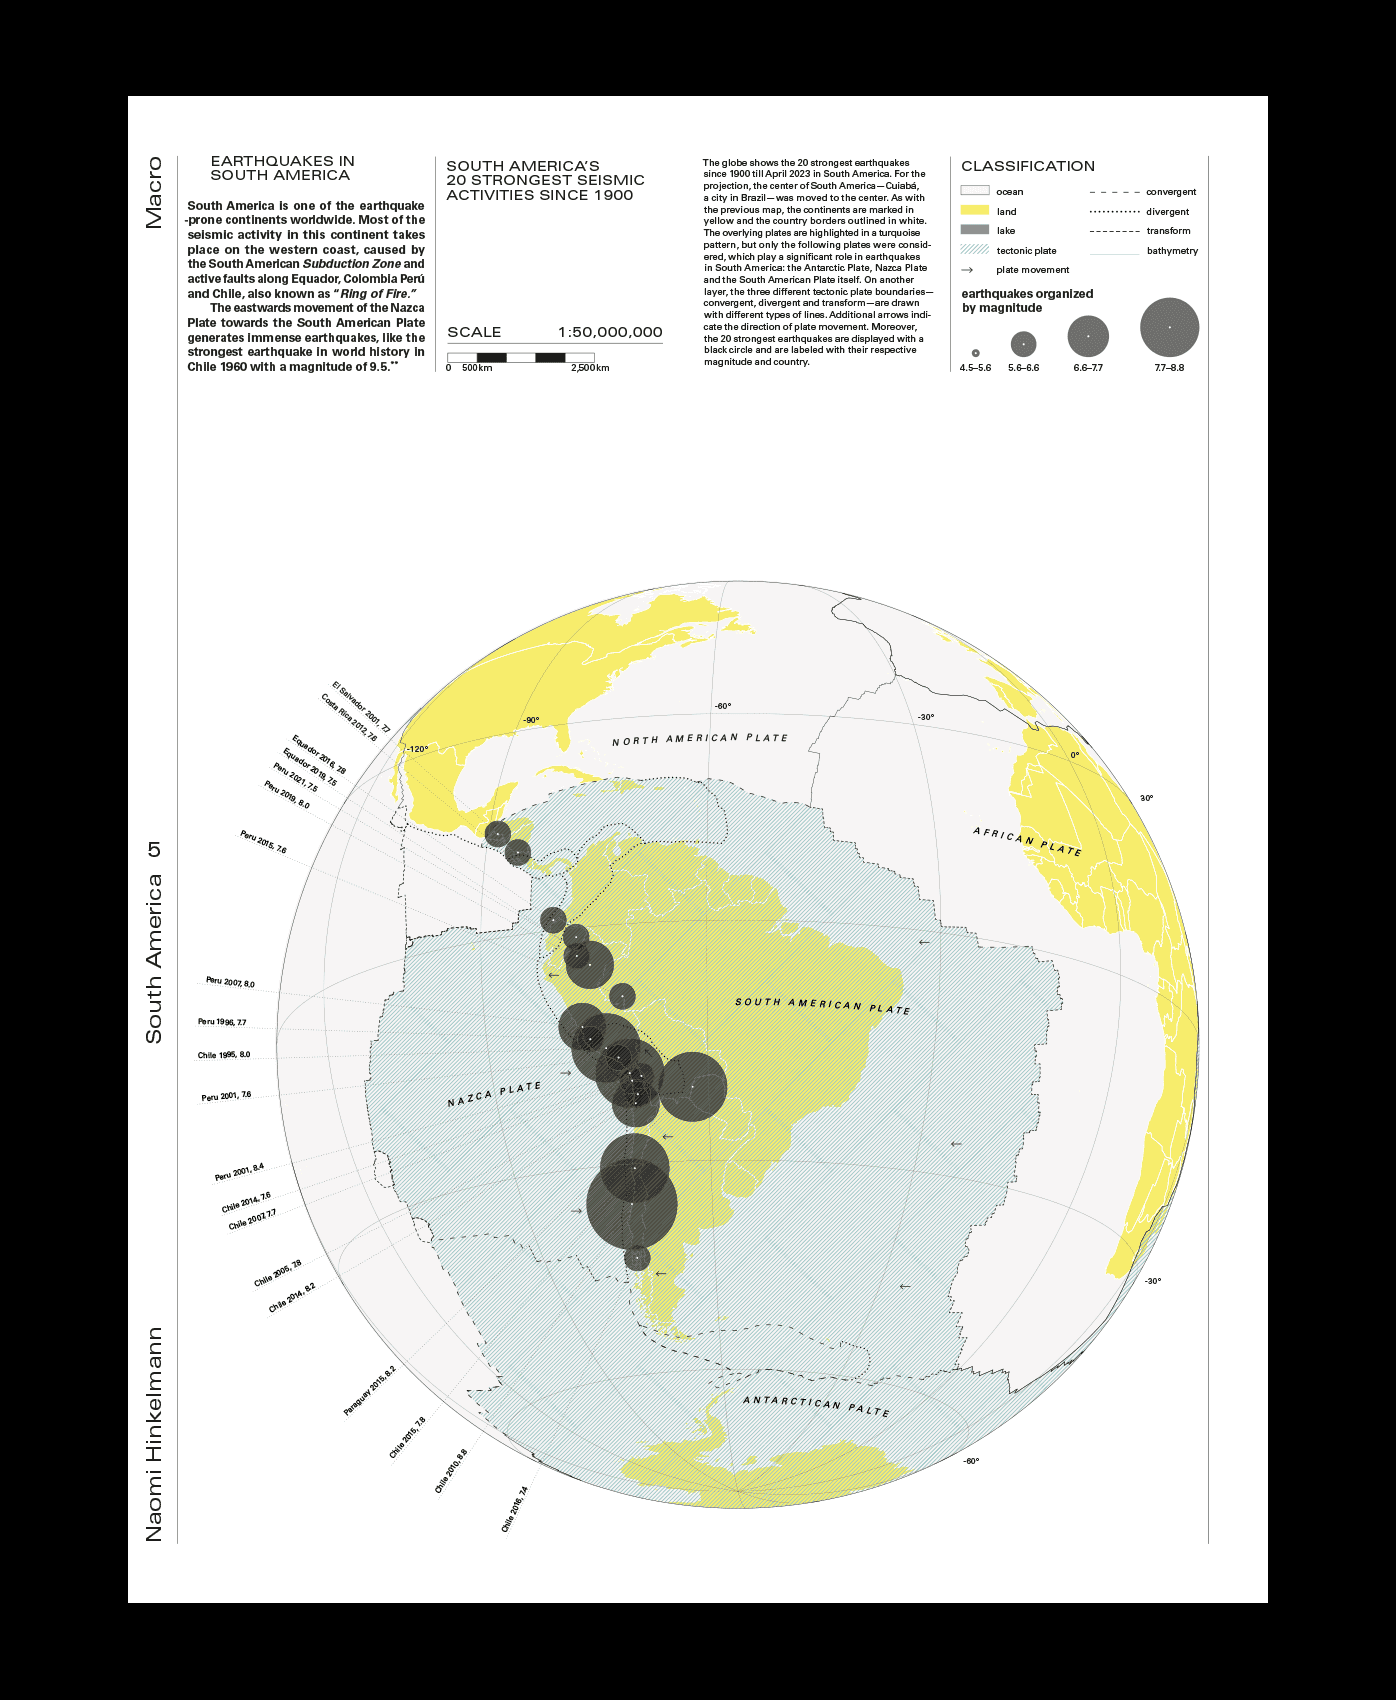
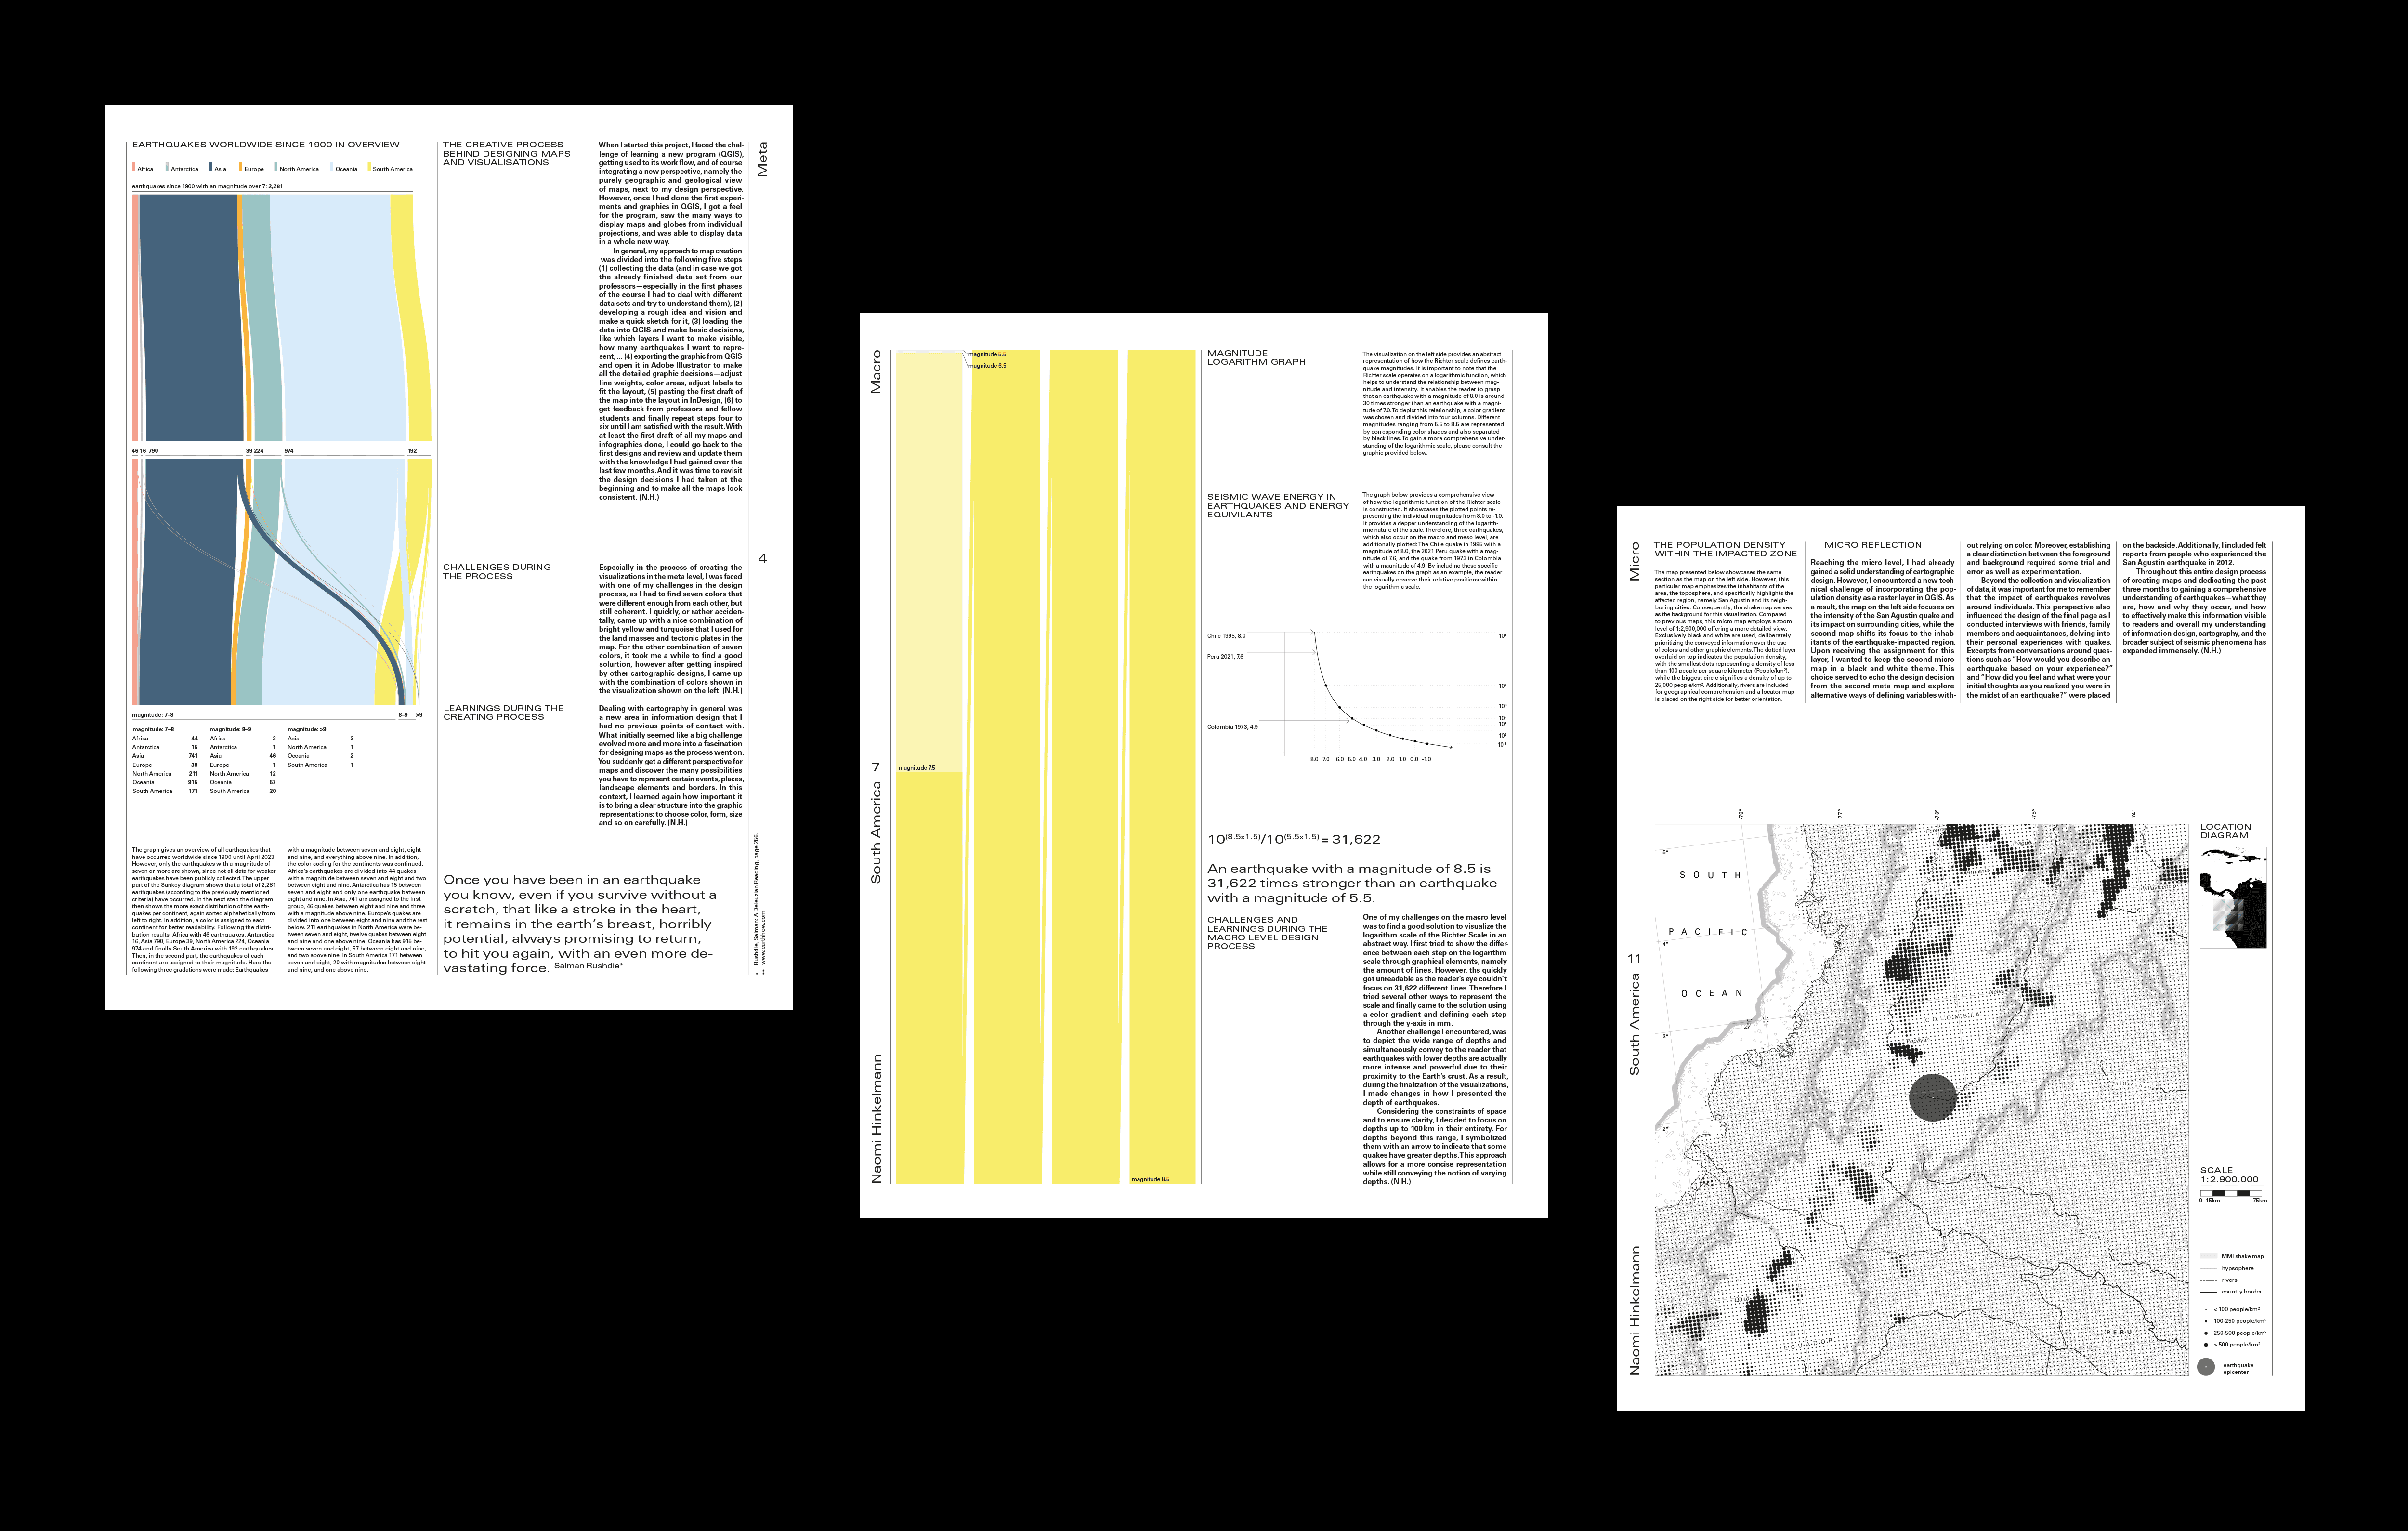
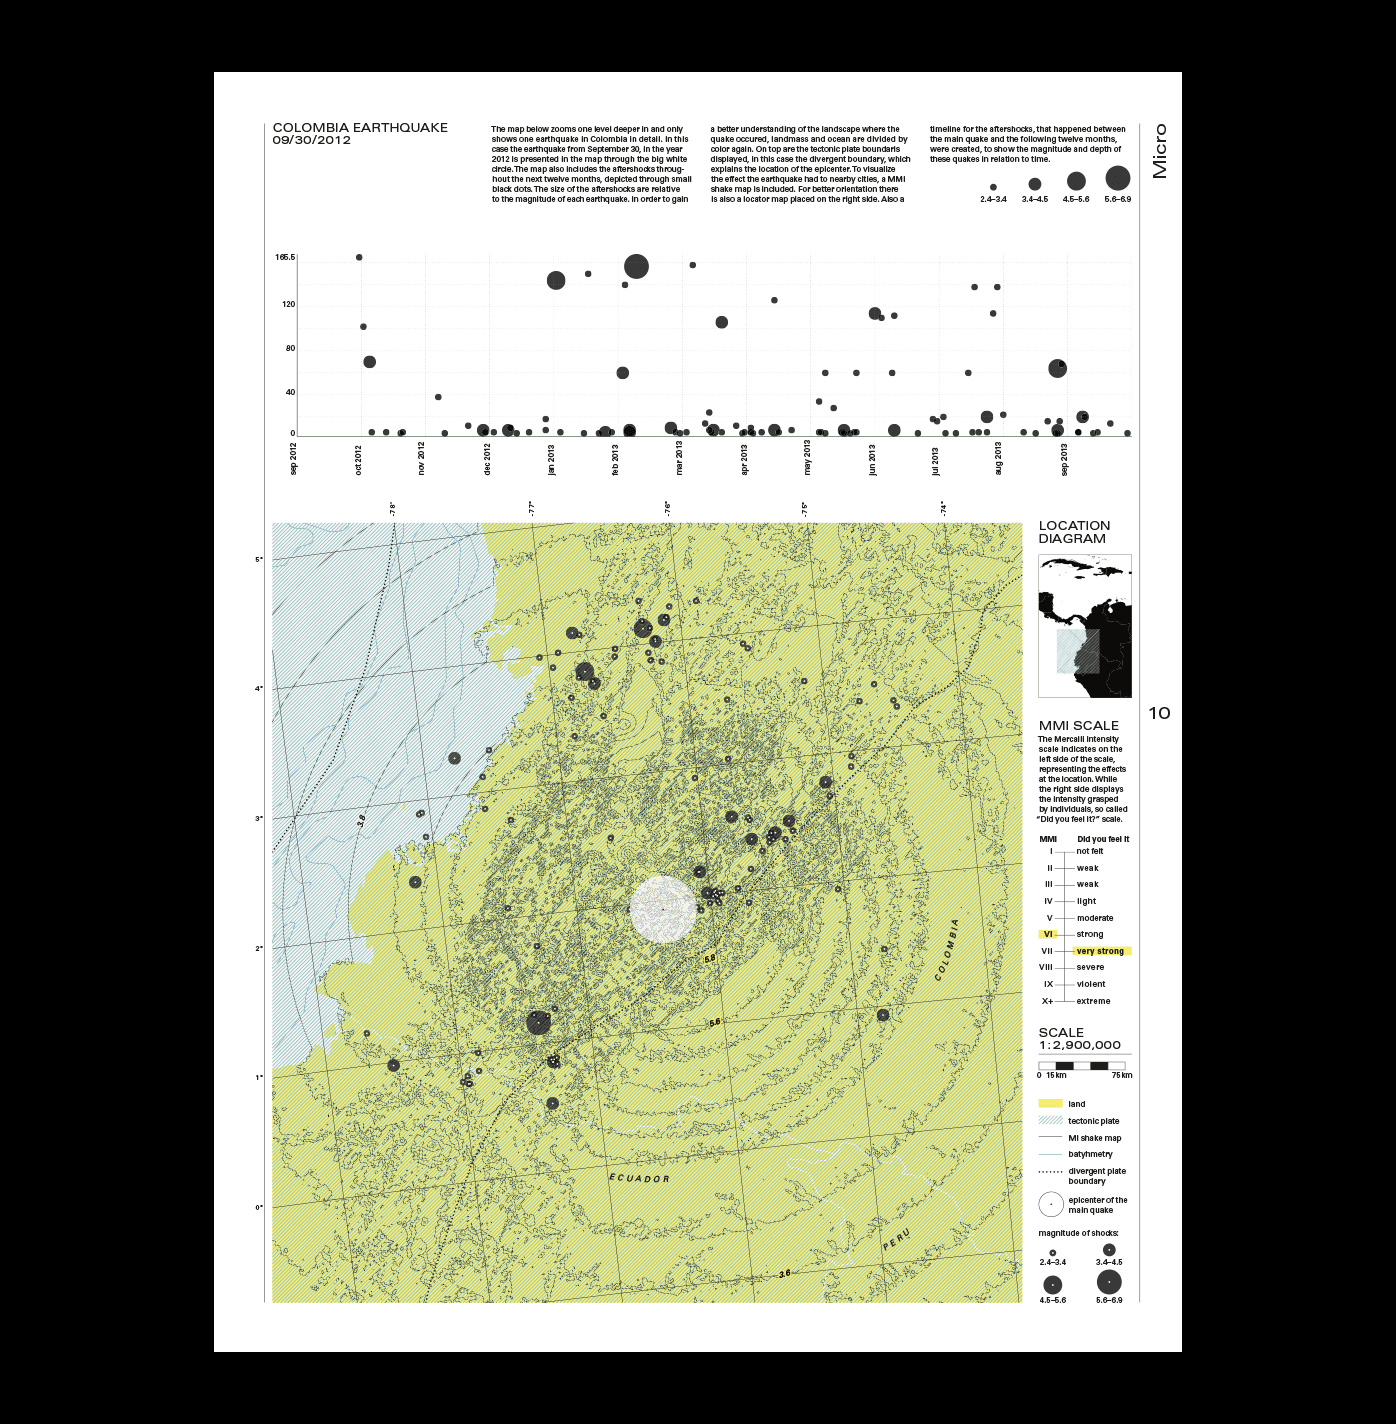
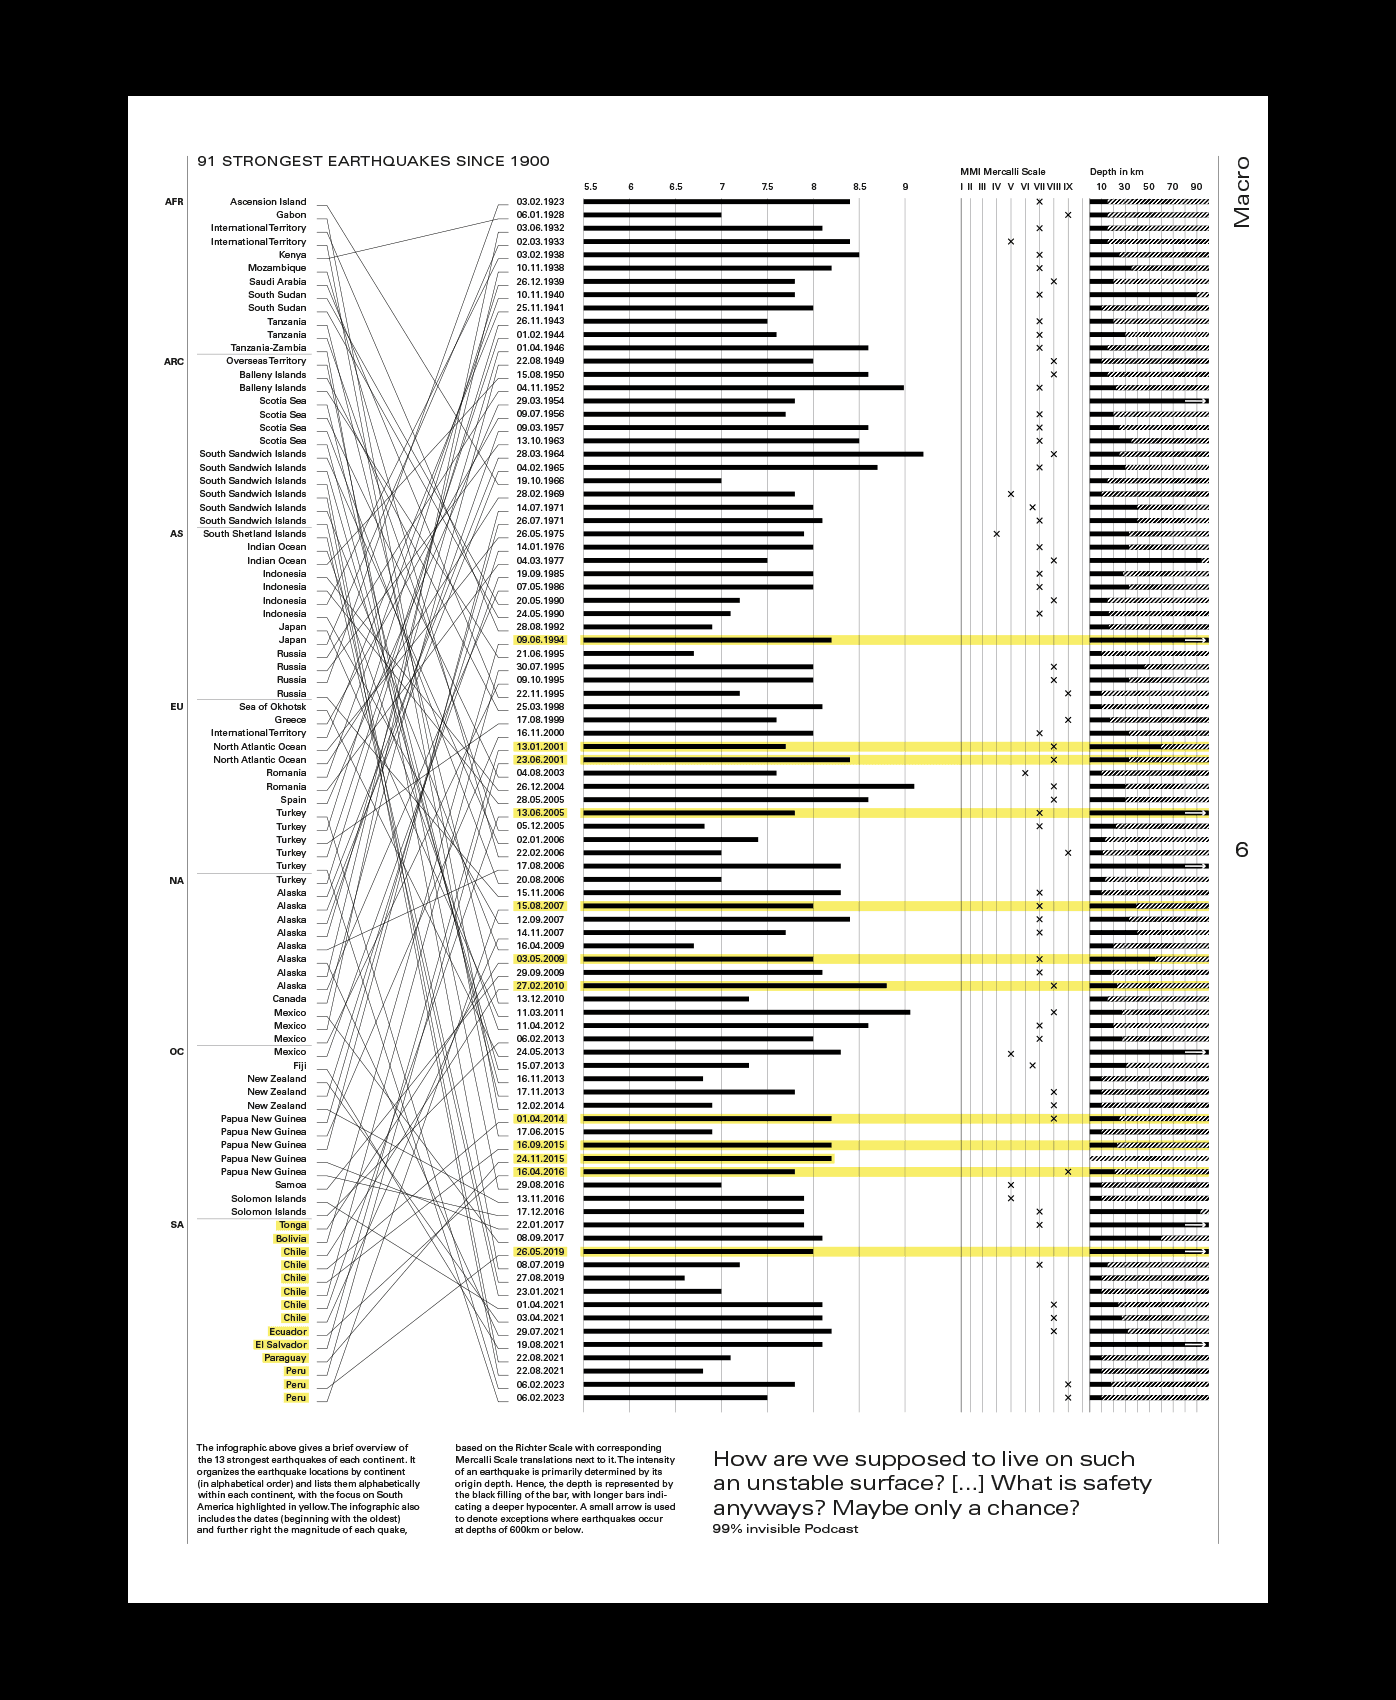
A key focus of my contribution to the publication is the analysis of earthquake dynamics in South America and Colombia. Like the other sections, it is structured across four levels—Meta, Macro, Meso, and Micro—each offering a deeper understanding of seismic phenomena through infographics and maps. The Meta level provides a global perspective on tectonic activity, while the Macro level highlights the 20 strongest earthquakes in South America since 1900. The Meso level examines Colombia’s seismic patterns and geological complexities, leading to the Micro level, where I analyze the San Agustín earthquake of September 30, 2012, in detail.
By combining data visualization and seismology, the Global Earthquake Atlas demonstrates how interdisciplinary collaboration can make complex scientific data more accessible and engaging.
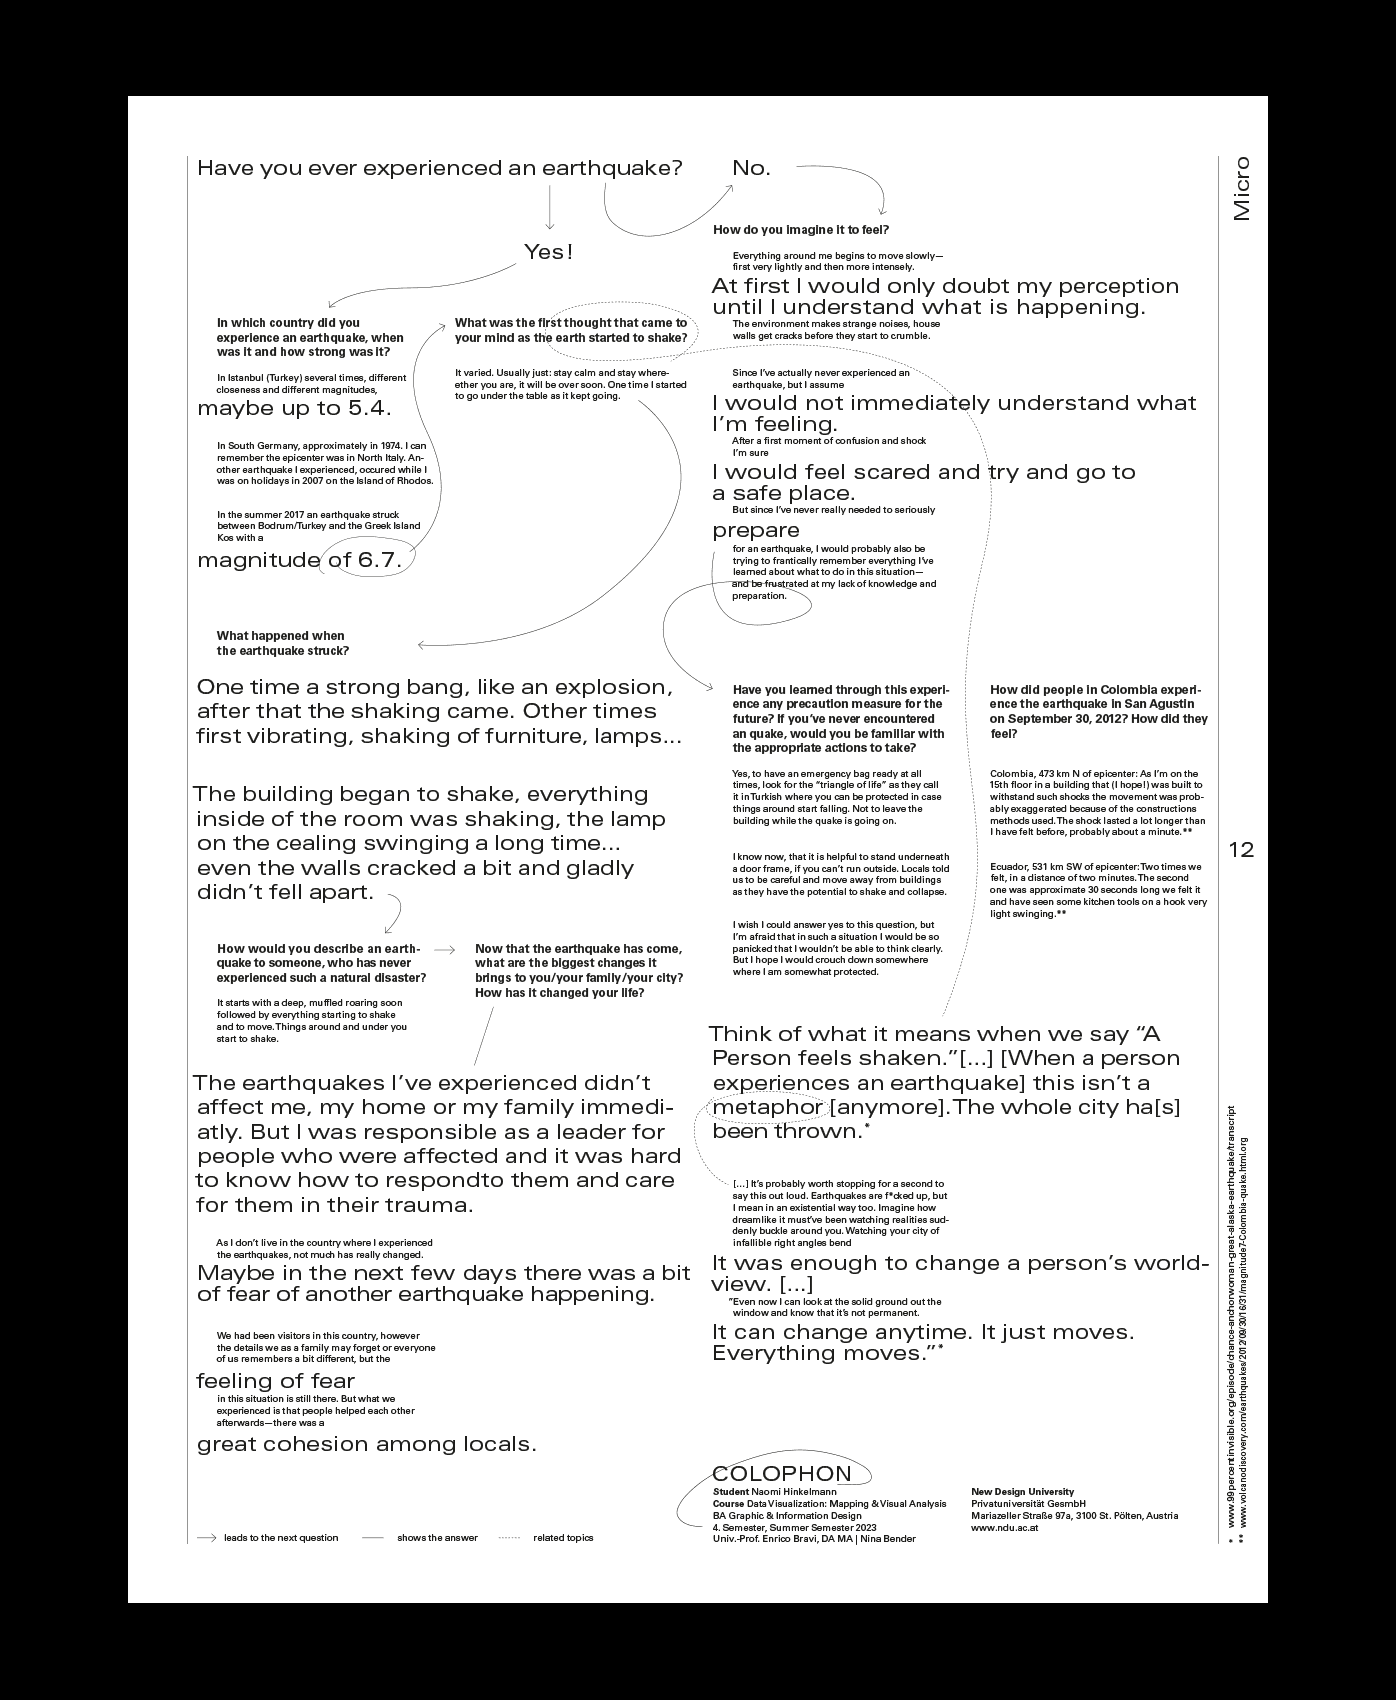
The concluding page of my work is dedicated to encapsulating the human experiences associated with earthquakes, visually portrayed through typographic representations. Drawing on quotes and firsthand accounts from the analyzed earthquakes, as well as insights gathered from family, friends, and acquaintances, this section provides a poignant reflection on the personal impact and significance of seismic events.